

Lüders Bands: Simulator and Explanation (Yield Point, Plateau, Stretcher Strains)
Free interactive Lüders band simulator: pull a mild steel bar and watch the yield band form at the shoulder and run along the bar at 55° while the force stays flat. Upper and lower yield, the Lüders plateau, band speed, machine stiffness, notches, strain ageing and bake hardening, real photos and the full explanation.
Pull a bar of mild steel and, just after it starts to yield, a dull stripe appears at one end and creeps along the bar at a slant while the force stays flat. That stripe is a Lüders band. Press Start and watch one form, then add a notch, change the testing machine, or bake the bar and test it again.
The bar and the machine
Unload, wait, pull again: strain ageing
Stretch the bar past the plateau, take the load off, and pull it again. Straight away it just carries on hardening: the dislocations are free. Wait (or bake it) and the carbon atoms find them again: the yield point and a new Lüders band come back, higher than before.
Inside the metal: why there is an upper yield point
Click anywhere on the bar above to watch that slice. Not to scale: a real dislocation line is about a millionth of a millimetre across, and millions of them break free together in each grain the front crosses.
Why the band leans at about 55°
Draw a circle on the sheet, then stretch it: it becomes an ellipse, longer along the pull and narrower across. Only two directions keep their length, where the circle and the ellipse cross. The band front has to lie along one of them, because the stretched steel behind the front and the unstretched steel ahead of it must stay joined along the whole front without tearing or overlapping.
Drag the orange handle (or the slider) to turn a line on the sheet and read how much it stretches. r is the Lankford value: how much a sheet thins in width compared with thickness. r = 1 is an evenly behaving metal and gives 54.7°; deep-drawing steels have r ≈ 1.6 to 2, so their bands lean a little less.
What Lüders bands look like for real

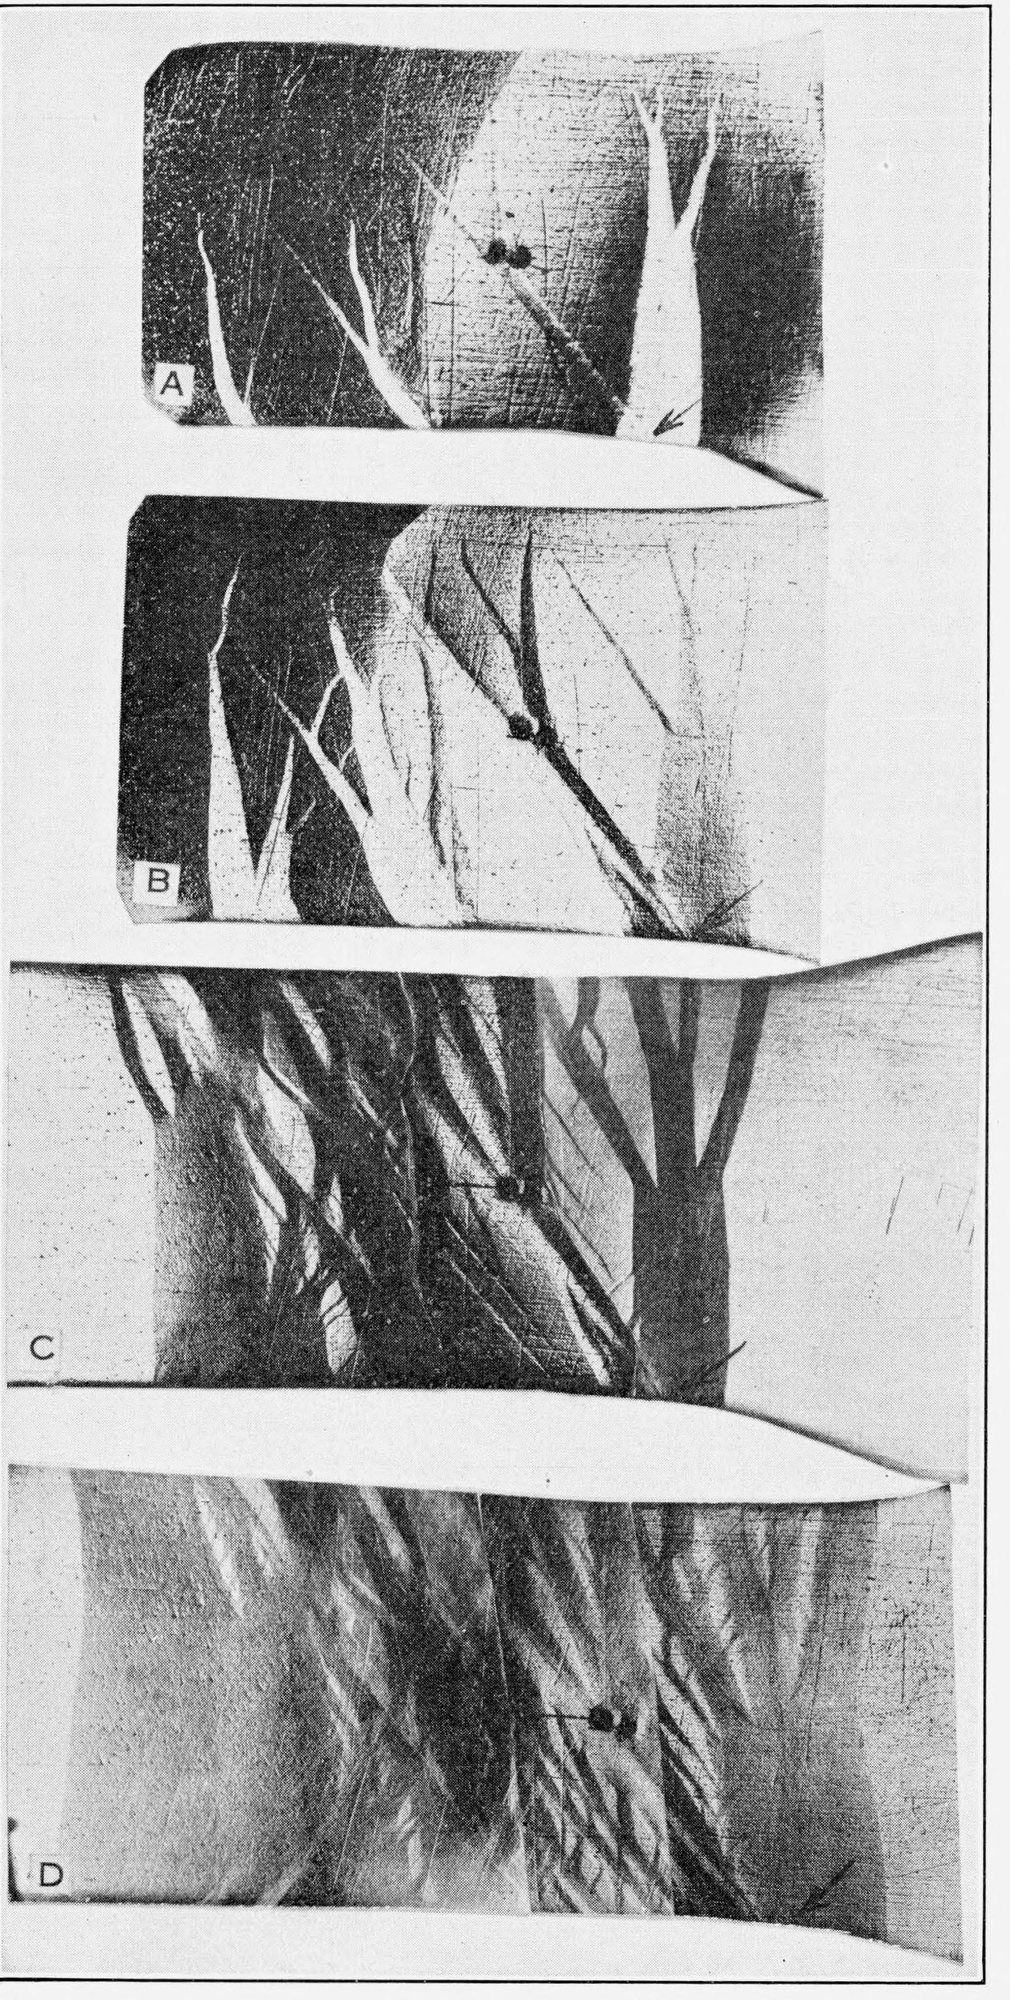
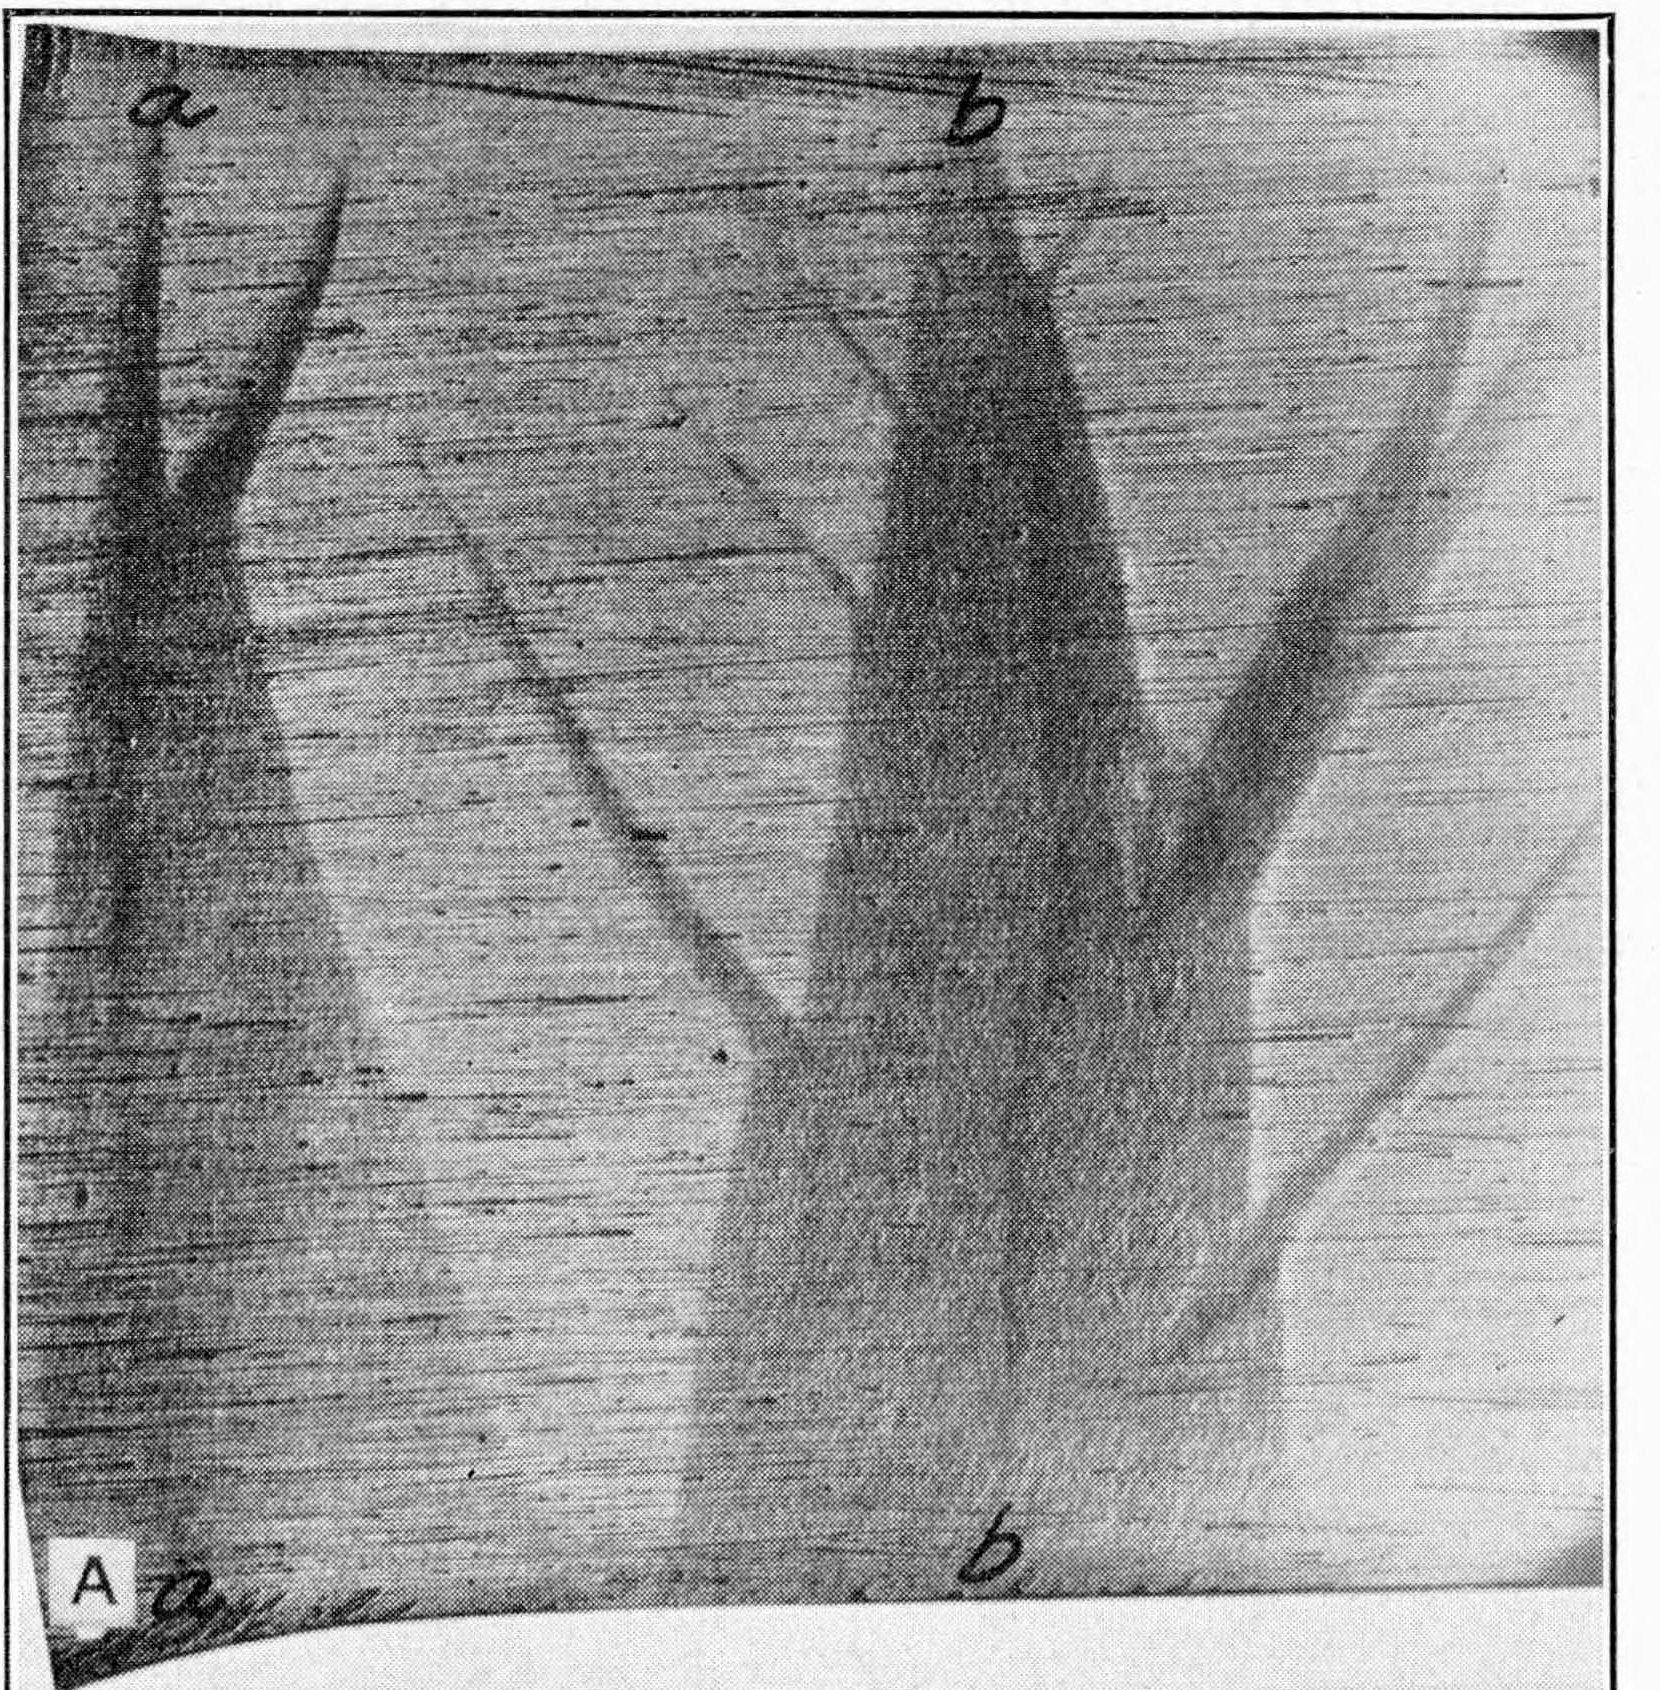
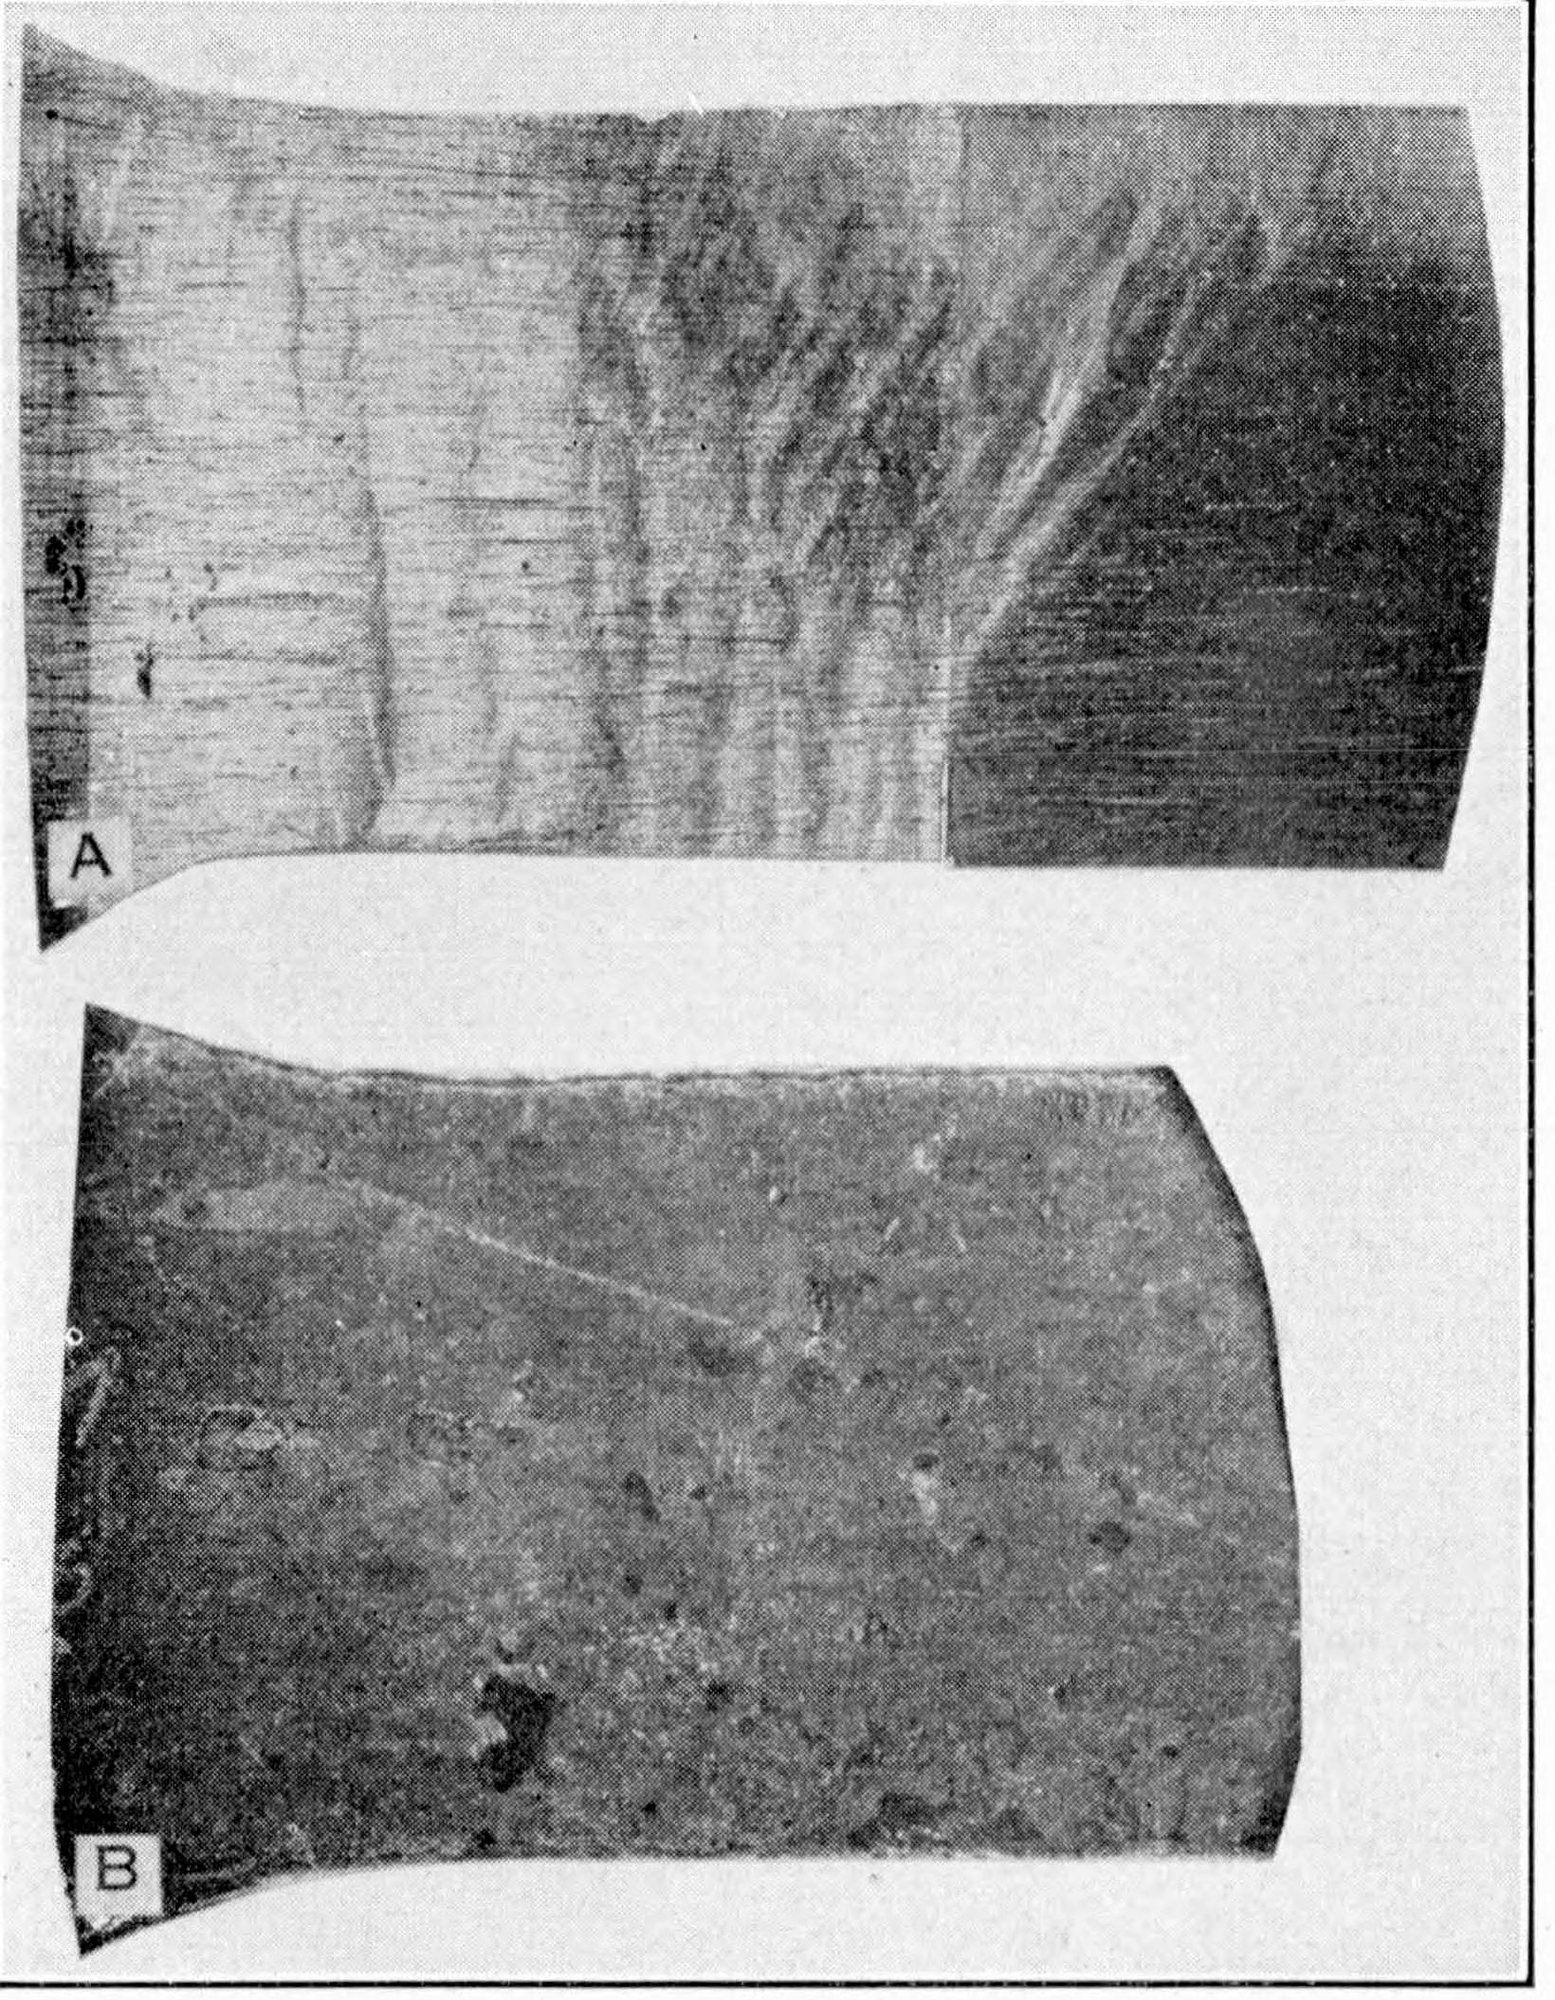
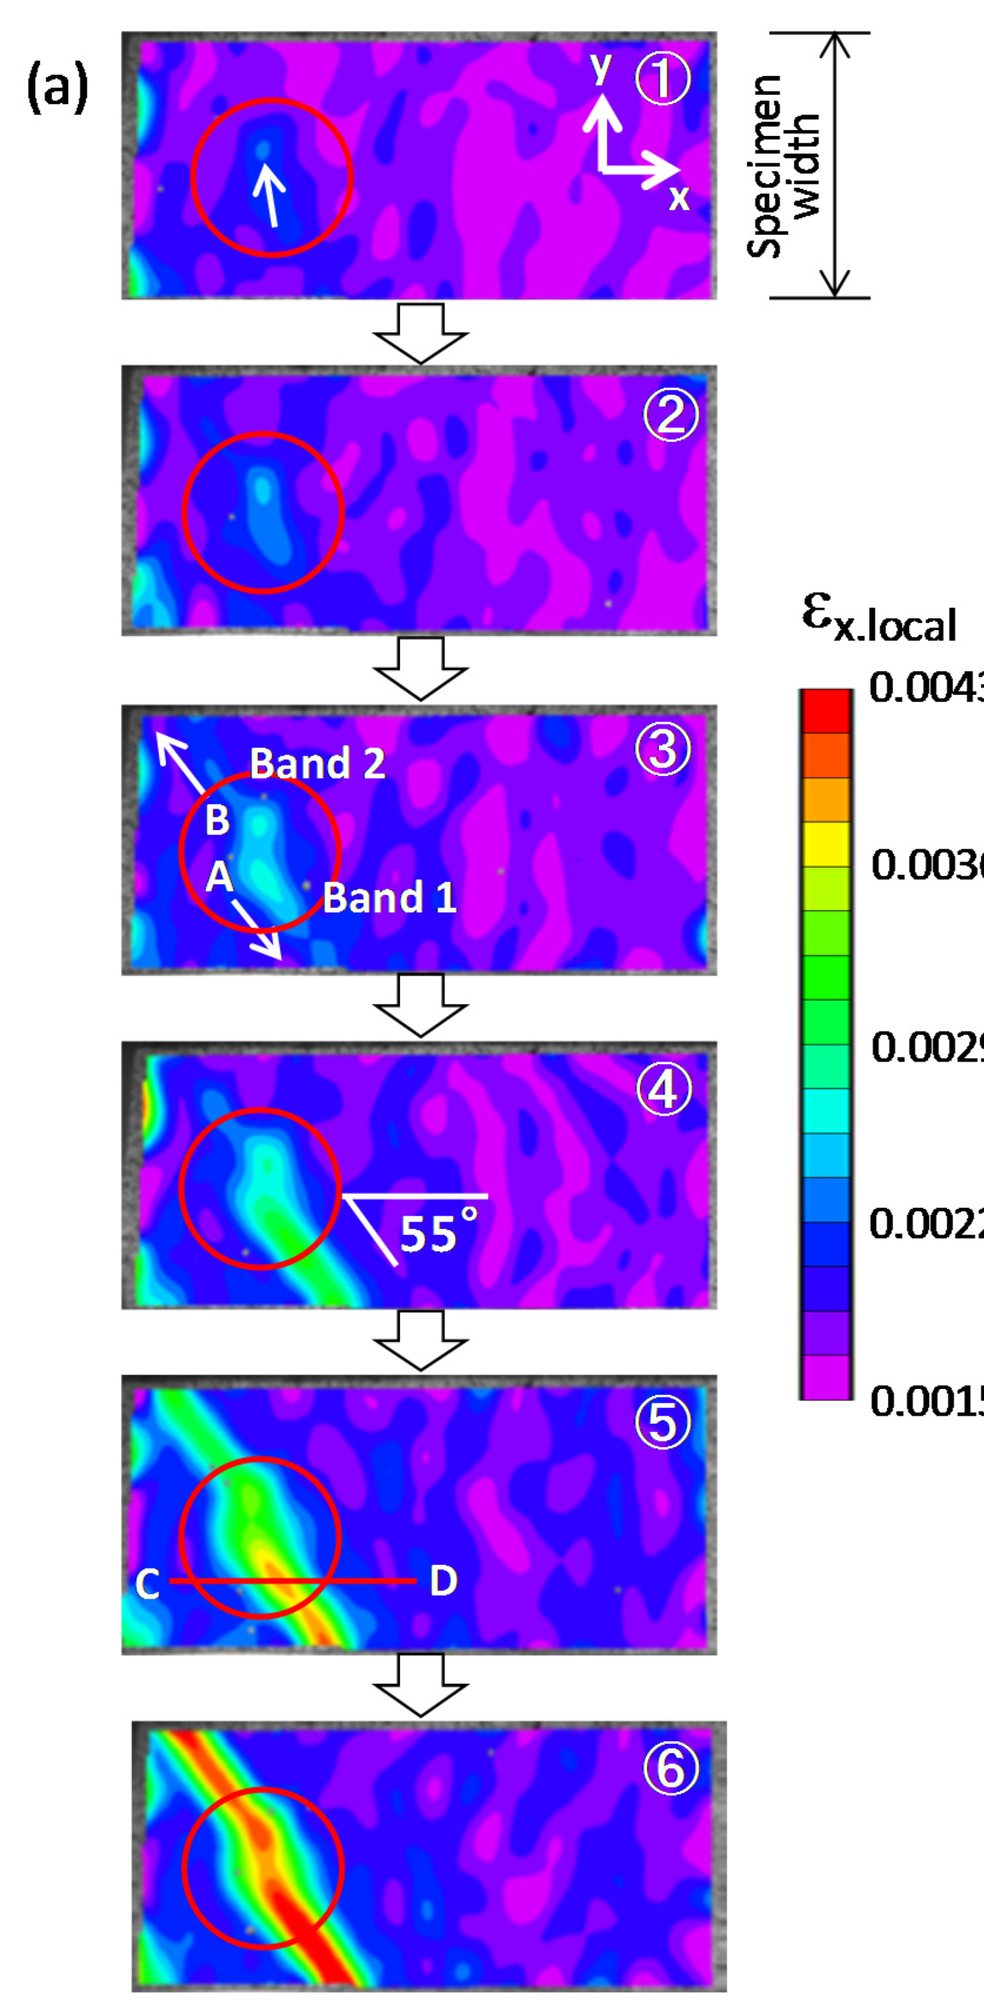
Video: “Luders Bands” by Prelude610 on YouTube: a real test where you can see the band run along the bar while the force stays flat. Compare it with the simulator on the Polished setting.
Lüders bands, explained
A Lüders band (also called a Piobert-Lüders band, a yield band or, on pressed sheet, a stretcher strain) is a stripe of metal that has yielded while the metal on either side has not. It shows up in low-carbon steel and in aluminium-magnesium alloys just after yielding starts. The band is not a crack and not a weakness: it is simply the boundary between stretched and not-yet-stretched metal, and it moves.
The French artillery officer Guillaume Piobert saw these stripes on iron plates in the 1840s, and the German engineer W. Lüders described them on bent steel bars in 1860, which is where the name comes from. Their cause was only explained a century later, by Alan Cottrell and Bruce Bilby in 1949.
What you see in a tensile test
- Elastic stretch. The force rises in a straight line. The whole bar stretches evenly, by a tenth of a percent or so.
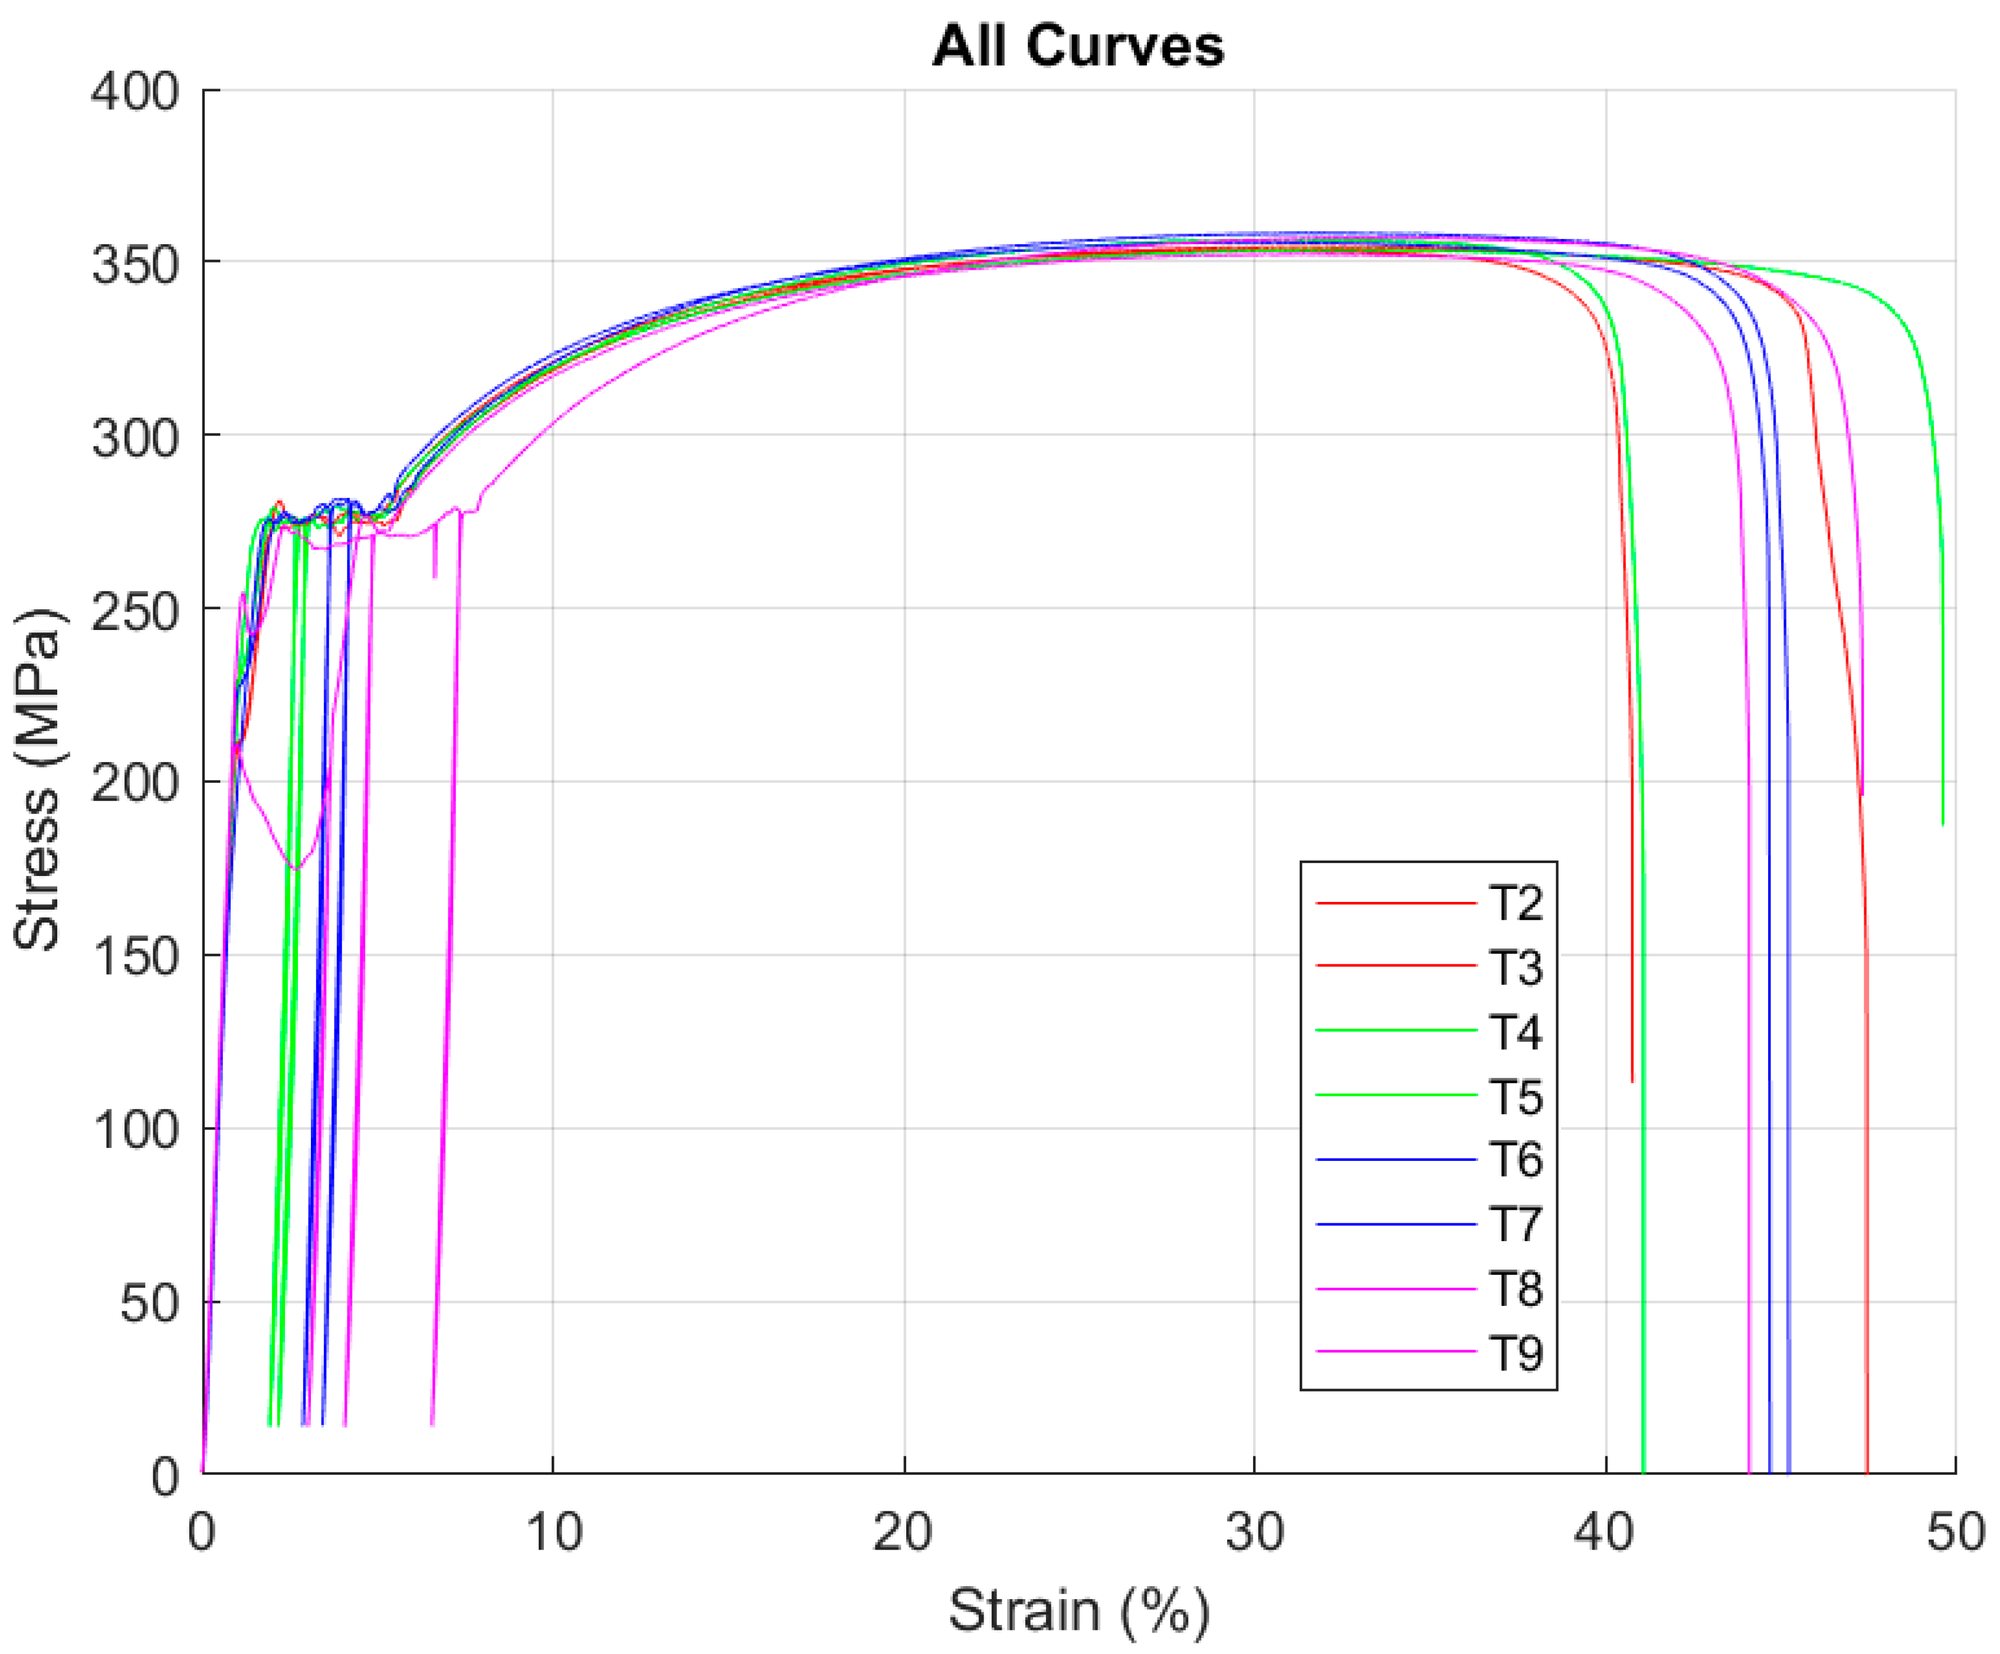
- Upper yield point. Somewhere the bar suddenly gives: usually at a shoulder, where the change of width concentrates the stress, or at a scratch, notch or inclusion. The force drops.
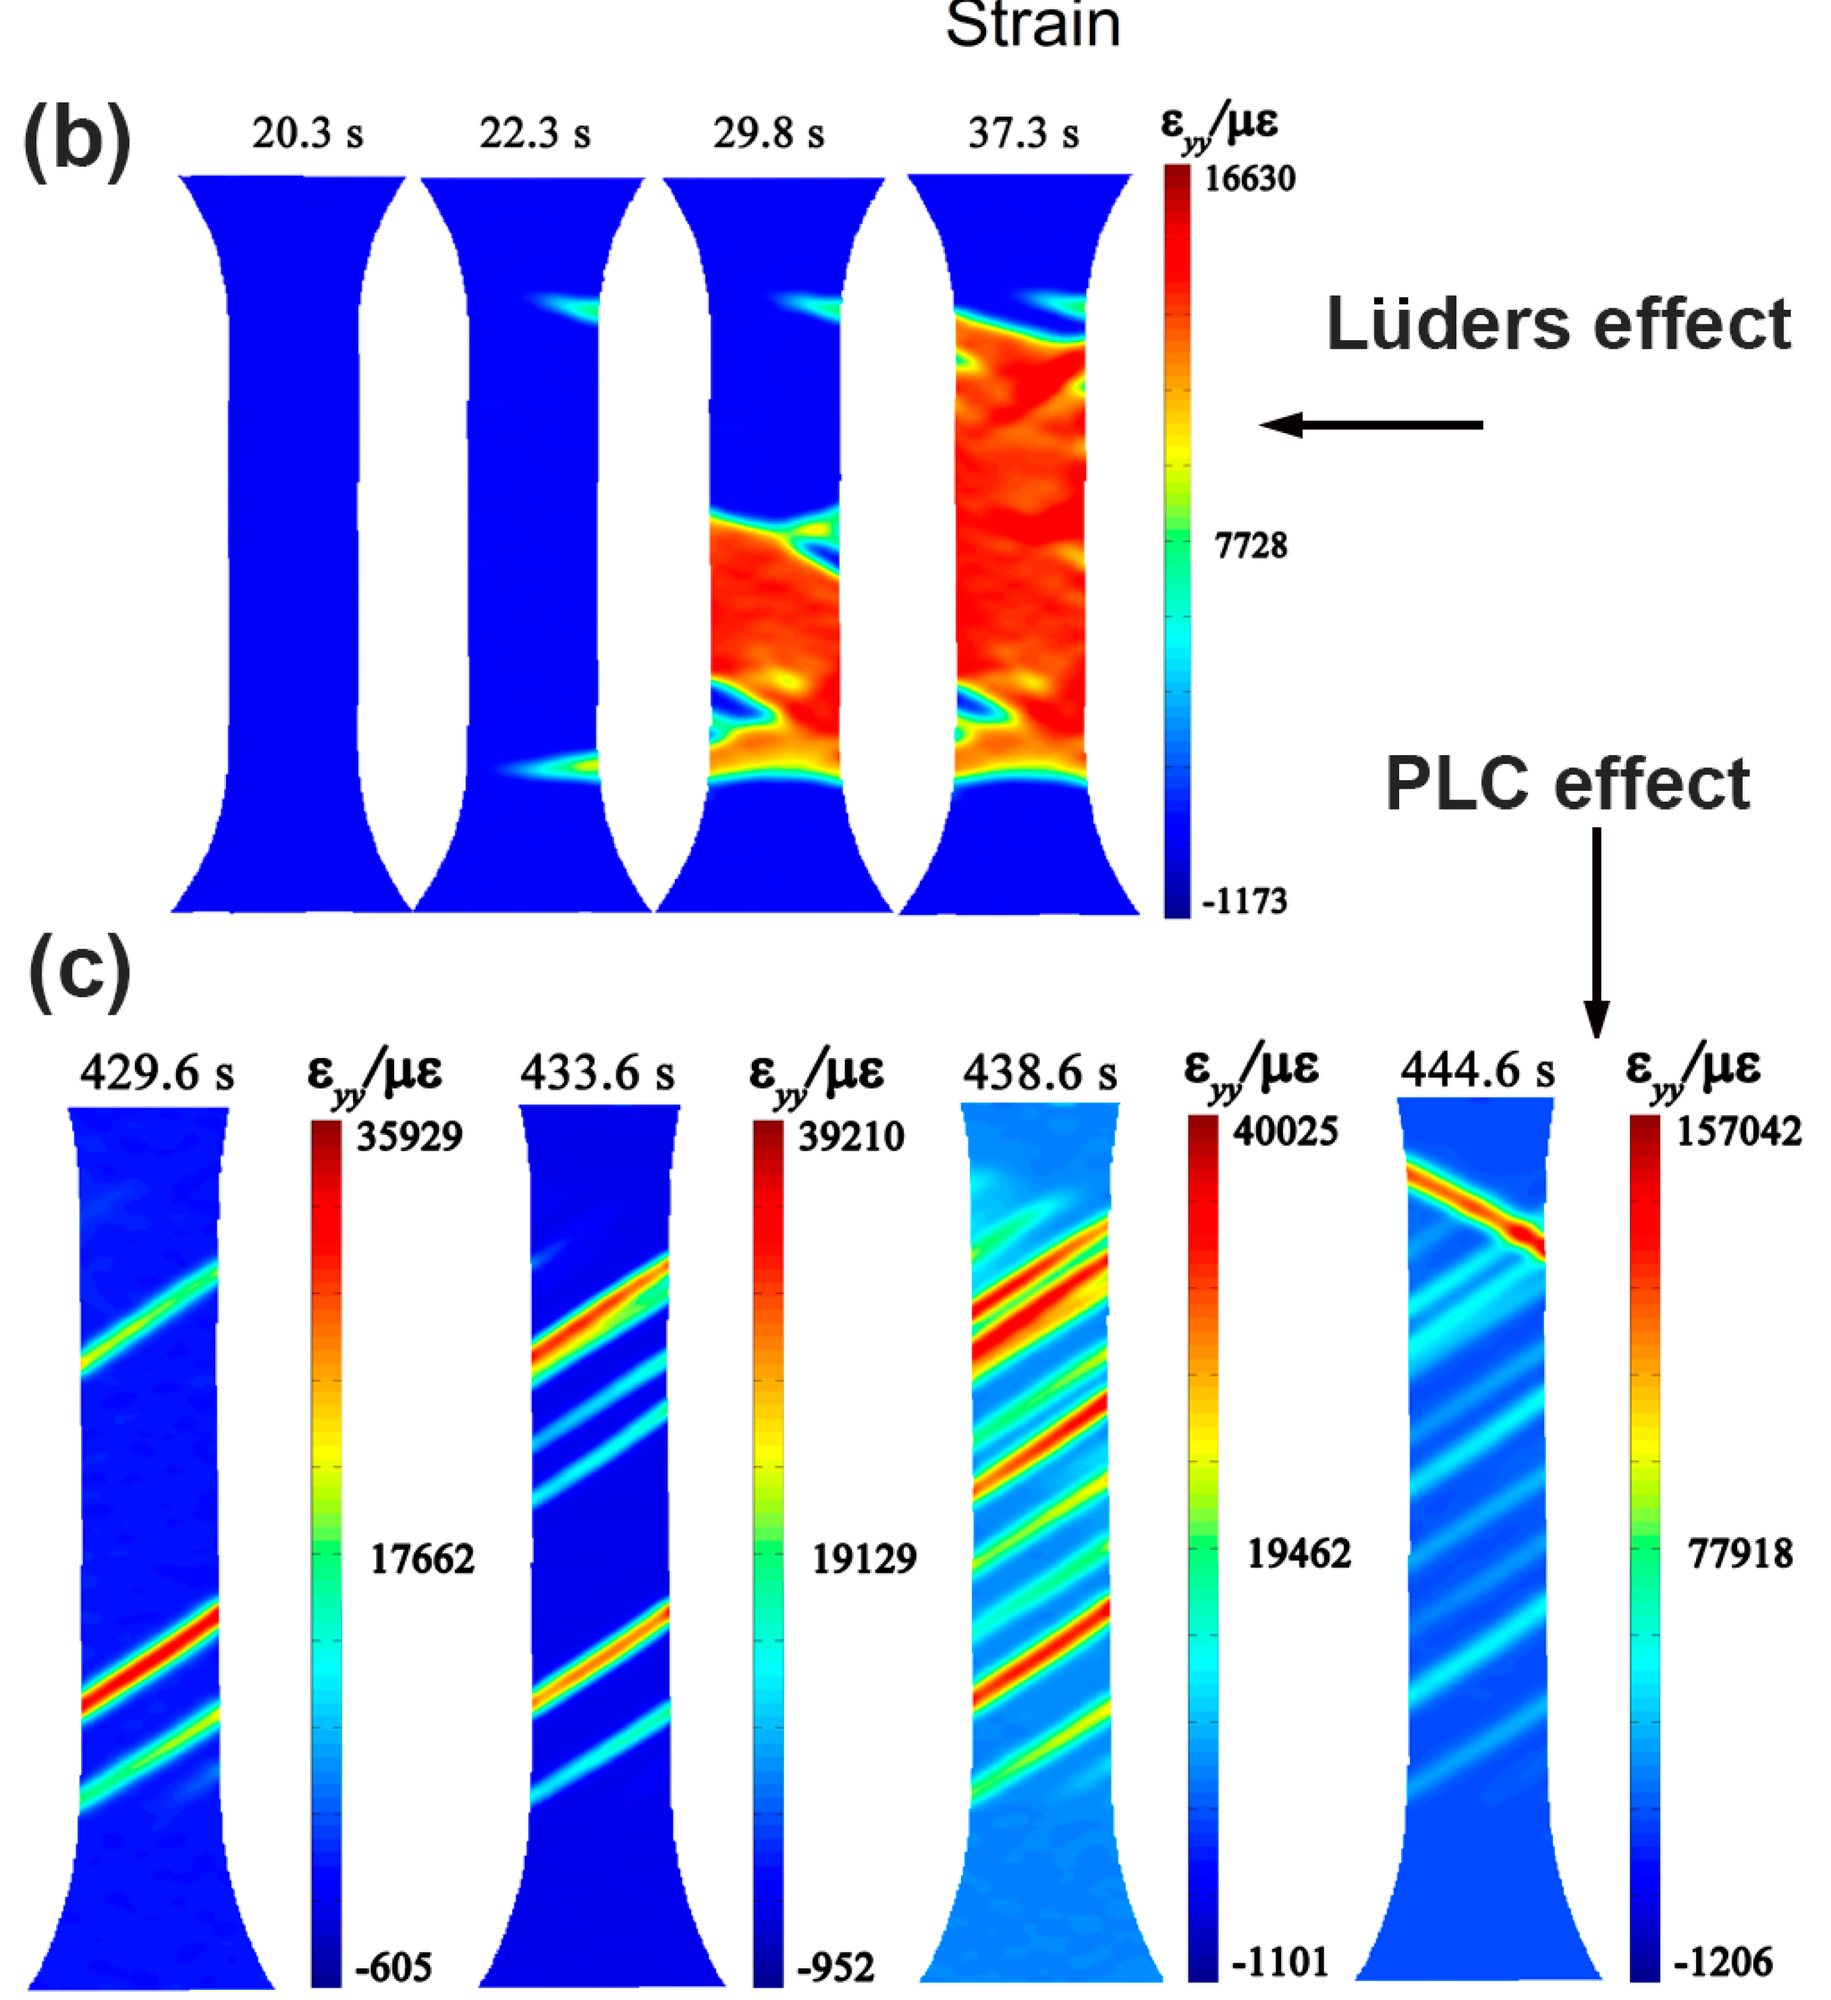
- The Lüders plateau. A band forms where it gave. Its edges (the fronts) move along the bar at a steady speed while the force stays almost flat at the lower yield stress, with small wiggles. Behind a front the steel has stretched by the Lüders strain εL, typically 1 to 3%; ahead of it, it has not stretched at all.
- Work hardening. When the fronts have crossed the whole gauge length the bar starts to harden evenly and the force rises again, as in any ductile metal.
On a polished bar the band looks dull or frosted, because the stretched surface roughens at the grain scale. On hot-rolled steel the brittle mill scale cracks and flakes off along the band, which is how the bands were first noticed. In a strain map made by digital image correlation (DIC) the band is a sharp step of strain sliding along the bar.
Why mild steel has an upper yield point
Steel yields when dislocations (line defects in the crystal) glide. In low-carbon steel, small carbon and nitrogen atoms sit in the gaps of the iron crystal and gather around the dislocations, where there is more room: these clouds are called Cottrell atmospheres. They pin the dislocations. It takes a higher stress to tear a dislocation away from its atmosphere (the upper yield) than to keep a free one moving (the lower yield). Once some dislocations are free they multiply quickly, so the metal at that spot stretches a lot all at once: that is the drop and the start of the band.
Why does the band grow from its edges instead of starting everywhere? Right at a front, the stretched metal behind it pulls on the unstretched metal ahead of it, and this local stress concentration is enough to unpin the next grains at the lower yield stress. Everywhere else the steel would still need the full upper yield stress, which the bar no longer reaches. So the front marches on, grain by grain.
The band speed
During the plateau the force does not change, so neither does the elastic stretch of the bar or the machine. All of the crosshead travel goes into turning unstretched steel into stretched steel at the fronts. If the crosshead moves at speed V and there are n fronts, each moving at speed v:
With V = 5 mm/min and εL = 2% one front moves at 250 mm/min, fifty times faster than the crosshead. The plateau lasts
for a gauge length L: 12 seconds for a 50 mm gauge at 5 mm/min. The simulator measures the front speed as the band moves and shows it next to this formula; in the space-time map each front is a straight line whose slope is the speed. A band that starts in the middle (try the notch) has two fronts, each moving at half the speed.
Why the front leans at about 55°
The stretched steel behind the front is longer and narrower than the steel ahead of it, yet the two have to stay joined along the front. That only works along a line whose length does not change. Pulling a sheet along x gives a strain ε along the pull and, because metal keeps its volume when it flows, a strain of about −ε/2 across the width. A line at angle θ to the pull stretches by
In real sheet the width strain depends on the plastic anisotropy (the Lankford value r: width strain = −ε r / (1 + r)), giving tan² θ = (1 + r) / r. Fronts in flat bars are usually seen at 50 to 55°. Round bars have no such line, so their fronts form cones and are much harder to see.
The testing machine matters
The machine and the bar act like two springs in series. When a slice of the bar yields, its sudden plastic stretch lets the machine spring back and the force drops. A stiff machine drops the force sharply and shows a tall, narrow upper yield peak. A soft machine stores more elastic energy, so the drop is spread out and the peak looks rounder. The upper yield also rises with the test speed and with any bending from badly aligned grips, and it is lowered by sharp shoulders. That is why standards report the lower yield stress (or the plateau) as the material property, and why the upper yield point varies so much from test to test.
Strain ageing: the yield point comes back
Unload a bar after the plateau and pull it again at once: it carries on hardening with no new yield point, because its dislocations are free. Wait, and carbon atoms diffuse back to the dislocations and pin them again. After a few weeks at room temperature (or minutes at 100 to 200 °C) the bar shows a new, higher upper yield point, a new plateau and new Lüders bands. This is strain ageing; its time scale follows the diffusion of carbon in iron (activation energy about 84 kJ/mol), and the pinned fraction grows roughly as t2/3 (Cottrell and Bilby). Car makers turn it into an advantage with bake-hardening steels, which gain strength during the 20-minute paint bake at about 170 °C. The simulator's "Test, bake, test again" runs the whole experiment.
Stretcher strains on pressed parts, and how they are avoided
If annealed low-carbon sheet is pressed into a shallow part, the areas strained only into the plateau show irregular dull bands and ridges called stretcher strains (or "worms"). Paint does not hide them, so they ruin visible panels. Steel makers prevent them by:
- Temper rolling (skin pass): a light 0.5 to 2% cold roll after annealing yields the whole sheet evenly, so it has no yield point when it reaches the press. The effect wears off as the sheet ages, so it should be used within weeks.
- Roller levelling just before pressing, which does the same at the press shop.
- Interstitial-free (IF) steels: titanium or niobium tie up all the carbon and nitrogen, so nothing pins the dislocations at all.
Aluminium-magnesium (5000-series) sheet has the same problem: magnesium atoms pin dislocations like carbon does in steel, giving type A stretcher strains at yield and, later, the jerky Portevin-Le Chatelier bands that keep appearing during hardening. That is why 5000-series alloys are used for inner car panels and 6000-series for outer ones.
How the simulator works
The gauge length is cut into 160 thin slices. Each slice is pinned until the stress reaches its upper yield (a little lower near the shoulders and at any notch, and slightly different from slice to slice, as in real steel), then it stretches at about the lower yield stress until it reaches the Lüders strain, after which it follows a work-hardening curve. A slice next to a yielded one lets go at the lower yield. The machine pulls the crosshead at a steady speed, and the machine and the bar are treated as springs in series, so every bit of plastic stretch lowers the force. Nothing else is programmed in: the upper yield drop, the flat plateau with its small wiggles, the band speed and its formula, the effect of machine stiffness and the return of the yield point after ageing all come out of these rules. The numbers are typical values for each kind of metal (sources: Cottrell and Bilby 1949; Hall 1970, Yield Point Phenomena in Metals and Alloys; Butler 1962 on grain size and the Lüders strain; Hall-Petch constants for mild steel), not test data for a particular steel. The front angle and band speed are exact; the surface pictures are drawn to look like the real thing, with the thinning exaggerated so you can see it.
Questions
Are Lüders bands a sign of damage?
No. They show where the steel has yielded, that is all. In a structure, visible bands (or flaking mill scale or whitewash in a pattern) tell an inspector that the steel there was loaded past yield, which is worth knowing; the metal itself is not cracked.
What is the difference between the upper and lower yield strength?
The upper yield strength (ReH in ISO 6892-1) is the peak just before the drop; the lower yield strength (ReL) is the lowest stress during the plateau, ignoring the very first dip. The upper value depends strongly on the machine, the speed and the specimen, so design values are based on the lower yield or the plateau.
What is the Lüders strain?
The strain at which the plateau ends, i.e. how much each bit of steel stretches as a front passes. Typical values are 1 to 3% for mild steel; it is larger for finer grains and lower for coarse-grained or slightly prestrained steel.
Why does my extensometer show a jump, or nothing, during the plateau?
An extensometer only measures between its knife edges. While a front is outside them it reads no plastic strain; when the front crosses them it reads a fast jump. The force-crosshead curve looks smooth because it averages over the whole bar.
Do Lüders bands happen in compression or bending?
Yes. Lüders first saw them on bent bars, and they form wherever low-carbon steel yields: in bending they start at the surface where the stress is highest, and in pipes and pressure vessels they can run as helical bands.
What are Hartmann lines?
The same thing, named after Louis Hartmann, who studied the line patterns on yielded steel in the 1890s. On large structures they are often called slip lines or yield lines.