
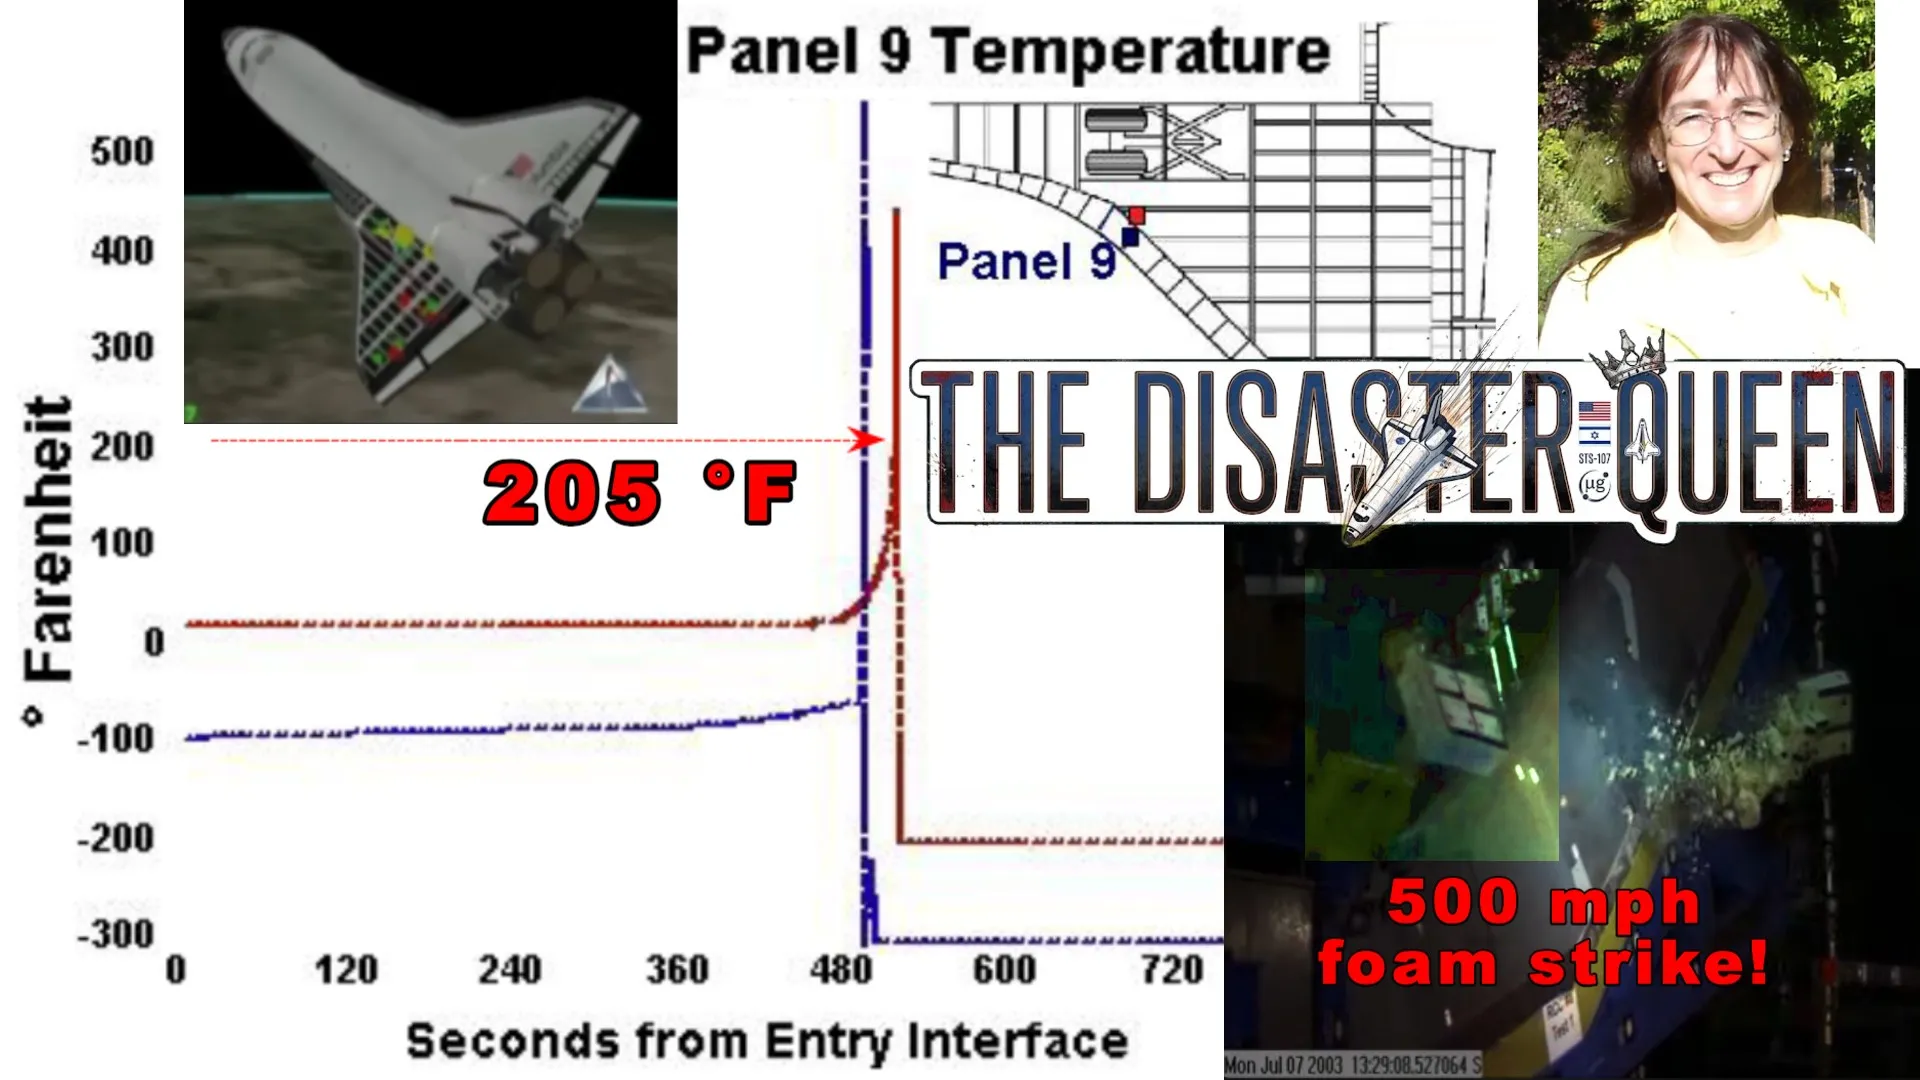
In this video, I show how Dr. Judy Wood worked out what caused the Space Shuttle Columbia disaster within days, while NASA only confirmed it about 5 months later. Watching the live coverage on February 1, 2003, she identified the damaged thermal tiles on the left wing, and 5 days later she gave her EM 304 (Mechanics of Materials) class a test problem about it. The flight's own thermocouple data later showed a temperature spike in the left wing at around 205 °F, the same value she had calculated in her problem.
Watch on: Notes · YouTube · Rumble · Odysee · BitChute · Telegram
Timestamps:
- 0:00 Dr. Judy Wood solved the Space Shuttle Columbia disaster right away!
- 0:33 Gemini AI summary of the emails DJW sent me about the Columbia disaster
- 0:49 DJW identified the thermal tile issue while watching live coverage on February 1, 2003
- 1:13 E212 and E208 camera angles of the foam strike during launch on January 16, 2003
- 4:02 DJW gave her EM 304 class the test just 5 days later, on February 6, 2003
- 4:52 Wile E. Coyote cuts a circular hole in a bridge to trap the Road Runner
- 6:15 NASA focused on the left wing 2 months later, but it wasn't until 5 months later that they obtained experimental confirmation that the foam strike would cause extensive damage to the wing
- 7:21 DJW's students called her "the Disaster Queen" for solving the Columbia disaster early on
- 8:18 July 7, 2003, foam strike test at 500 mph
- 10:40 Slides from Scott Hubbard's April 15, 2003, presentation
- 12:33 Thermocouple data showing a temperature spike in the left wing at around 205 °F, just as Dr. Judy Wood had already calculated!
- 13:38 Grok AI explanation of the temperature chart
- 15:54 The spike in temperature means the superheated plasma had entered the wing, but the Space Shuttle kept flying for another 400+ seconds
- 16:43 DJW's 205 °F annotation is a direct visual link between the real flight data and her idealized tube problem calculation
Notes and playlists:
Notes: Dr. Judy Wood solved the Space Shuttle Columbia Disaster right away!, CAIB Investigator Scott Hubbard April 15, 2003 presentation confirmed Dr. Judy Wood's analysis
Written notes — mirrored from Exam Problem by Dr. Judy Wood: Space Shuttle Columbia Disaster, which has the full video and the complete solution.
Dr. Judy Wood solved the Space Shuttle Columbia Disaster right away!
Dr. Judy Wood gave this test to her EM 304 class just 5 days after the Space Shuttle Columbia disaster, and months later NASA officially came to the same conclusion!
Here is a Gemini AI summary of emails that Dr. Judy Wood sent me regarding how she rapidly analyzed and solved the failure mechanism.
- Identifying the Thermal Tile Issue:
- Following the disintegration of the Space Shuttle Columbia on February 1, 2003, Dr. Wood watched the lift-off footage on television and analyzed the foam strike.
- She noticed that the foam made a right-angle turn and "dustified" upon impact, indicating it was a hard, significant hit rather than a light grazing.
- Recognizing the necessity of thermal tiles during re-entry to manage thermal expansion, she correctly deduced the exact location of the wing damage.
- The February 6, 2003 Test:
- Just five days after the disaster, Dr. Wood incorporated the real-world event into her EM 304 (Mechanics of Materials) exam on February 6, 2003.
- The test required students to calculate stresses, thermal expansion, and the failure temperature for the exposed aluminum substructure.
- To help students grasp concepts like shear stress versus normal stress, she famously used visual aids in her classes, including Roadrunner cartoons (such as the Coyote cutting a circular disk out of a bridge) to teach them how to identify the correct surface area.
- Around half of her students solved it completely, though many initially doubted their calculations because the resulting failure temperature (~205°F) seemed surprisingly low.
- NASA's Timeline to the Same Conclusion:
- It took NASA two months following the disaster (upon analyzing flight-data-recorder equivalent thermocouple data) to
officially update and confirm the exact failure location on the wingfocus their investigation on the left wing, and five months until they got experimental confirmation of the extensive damage caused by a foam strike—matching the conclusion Dr. Wood had already mapped out for her students' exam.
- It took NASA two months following the disaster (upon analyzing flight-data-recorder equivalent thermocouple data) to
- Other Notable Details:
- "The Disaster Queen": Dr. Wood was known by this nickname for her ability to analyze structural failures and apply them to coursework.
- NASA's Internal Awareness & Cover-Up: She noted that NASA management was aware of the foam strike early on and even discussed launching a "care package" of supplies to the space station that could have been redirected to the shuttle, but chose not to inform the crew of the serious danger. Furthermore, multiple requests by outside groups for spy-satellite imaging of the wing were cancelled by higher-ups.
- Experimental Validation: Months later, Columbia Accident Investigation Board (CAIB) investigator G. Scott Hubbard conducted physical tests—first on a fiberglass rehearsal wing and then on a real shuttle wing—that successfully replicated the exact damage pattern.
CAIB Investigator Scott Hubbard April 15, 2003 presentation confirmed Dr. Judy Wood's analysis
Here is one of the slides from Scott Hubbard's investigation that Dr. Judy Wood included in her test problem PDF that she sent me.
Alternative link: https://govinfo.library.unt.edu/caib/events/press_briefings/20030415/present_hubbard.html
 Note the landing gear door, showing the damage shown is to the left wing, exactly where Dr. Judy Wood pointed out.

Note that the image above is indeed of the left wing, as illustrated below.

Here is a Grok AI explanation for the above chart, since it doesn't come with any text.
This chart shows temperature data from sensors near Reinforced Carbon-Carbon (RCC) Panel 9 on the left wing leading edge of Columbia (STS-107) during re-entry.
It is from G. Scott Hubbard’s April 15, 2003 CAIB presentation. The graph plots temperature (°F) versus seconds from Entry Interface (EI). The two lines correspond to two different sensors in the Panel 9 region (shown in the small diagram at upper right):
- One line (typically the lower/blue-ish trace) is from a sensor that starts colder (around –100 °F).
- The other (red/brown) starts near 0–20 °F.
These are internal sensors (spar and clevis area behind/near the RCC panels), not external surface temperatures. Normal re-entry temperatures for these locations rise only modestly.
What the spike means
Around EI + 480–520 seconds both traces rise sharply. One climbs rapidly past ~200 °F and goes off-scale high (the sensor range tops out around 450 °F), then both drop off-scale low.
This does not mean the vehicle broke up at that instant. Columbia continued flying for several more minutes (loss of signal occurred near EI + 900 s). The spike and subsequent sensor failure indicate that superheated plasma had entered the wing through a breach in the leading-edge thermal protection system and was heating the internal structure and wiring. The sensors (or their wires) were destroyed by the heat—exactly the “wires cut or burned through” behavior Hubbard described in the briefing.
Later CAIB analysis identified the breach as originating near RCC panels 8–9 from the foam strike during ascent. The temperature data were one of the early lines of evidence pointing to heating inside the wing well before breakup.
Judy’s 205 °F annotation
In her exam materials she marks the rising portion of the red trace near 205 °F. That number is the failure temperature she calculated in the exam problem for the aluminum stiffener under constrained thermal expansion (shear failure at the plate connection). She is drawing a direct visual link between the real flight data and the temperature her idealized tube problem predicted would cause structural failure.
In short: the chart shows the moment hot gas entered the wing and began destroying sensors near Panel 9. The spike marks the onset of that internal heating event, not the final breakup, and Judy highlighted the 205 °F level to connect it to her thermal-stress calculation.
- Watch on: 3Speak · YouTube · Rumble · Odysee · BitChute · Telegram
- Full video and written notes: Exam Problem by Dr. Judy Wood: Space Shuttle Columbia Disaster
- Playlist: Space Shuttle Columbia Disaster YouTube playlist
- More math: mes.fm/math
Originally posted on the Hive blockchain →